Dominant India have the advantage
Of the last 12 ODIs between the two teams in India, the visitors have lost 11
S Rajesh
26-Feb-2011
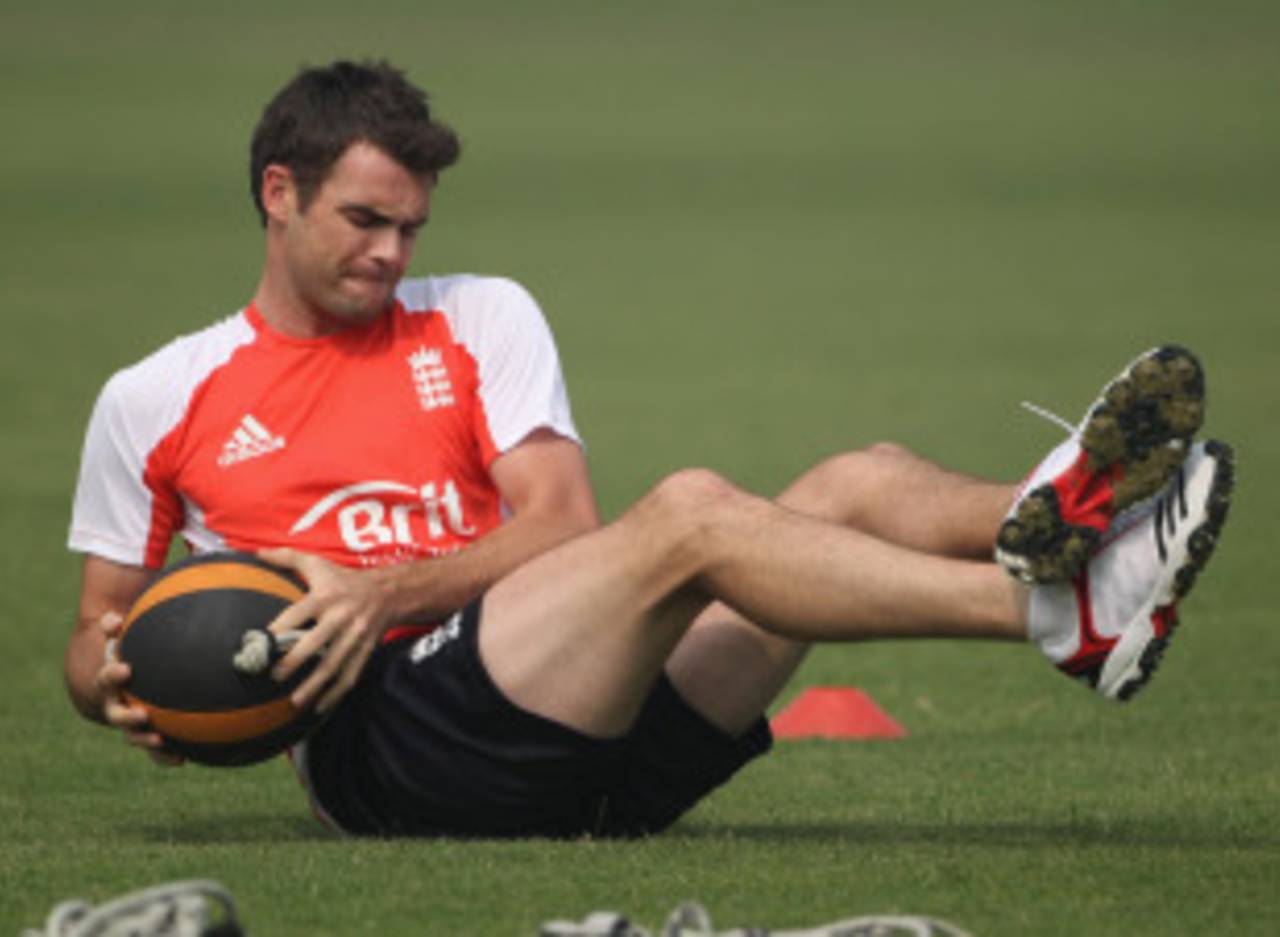
In the last 50 ODI overs that James Anderson has bowled in India, he hasn't taken single wicket and has gone at more than six runs per over • Getty Images
There are several reasons why India will fancy their chances in their second World Cup match, against England. Home conditions will almost certainly help them, as should the fact that they have, on paper at least, a far more power-packed batting line-up. India's recent form and their record against England at home should further boost their prospects.
All of these factors are reflected in the table below. The two teams have shared the spoils on the six occasions they've played in World Cups, but even there India have won the last two matches, in 1999 and in 2003. England's only consolation is that they beat India on the one occasion they played the hosts in a World Cup match in the country, defeating them by 35 runs in the semi-final in 1987.
The stat that's perhaps the most daunting for England is their recent ODI record against India in India. In 12 matches since the beginning of 2006, England have lost 11 times, with the only consolation coming in a dead-rubber game in Jamshedpur in the seven-match series in 2006. Of India's 11 wins, six have been when batting first and five when chasing, which suggests the team is equally comfortable doing either.
| Matches | India won | England won | |
| Overall | 70 | 38 | 30 |
| In World Cups | 6 | 3 | 3 |
| In India | 34 | 21 | 13 |
| Since 2006 | 19 | 14 | 5 |
| Since 2006 in India | 12 | 11 | 1 |
India's recent form has been pretty impressive too, with 37 wins and only 23 defeats in their last 64 ODIs since the beginning of 2009. When playing at home during this period, their win-loss record is even better, with 13 wins and six losses in 20 matches. Out of 15 series and tournaments they've played in the last 26 months, India have won nine.
England, on the other hand, have had a mixed time. They've had some memorable wins - most notably in South Africa and in the NatWest Series against Australia last year, but their 6-1 drubbing in Australia has been a huge dampener.
| Team | ODIs | Won | Lost | W/ L ratio |
| India | 64 | 37 | 23 | 1.60 |
| England | 47 | 25 | 22 | 1.13 |
Yuvraj Singh hasn't been at his best recently, averaging only 27.50 at a strike rate of less than 70 in 19 innings since the beginning of 2010, but a home game against England is probably the best way for him to regain his mojo. In 12 home innings against them, Yuvraj has scored 589 runs at an outstanding average of 73.62 and a strike rate of almost 110. His conversion rate has been superb too, with three centuries in the four innings in which he has topped 50.
England's bowlers have done fairly well against the rest of the Indian batsmen, though: Sachin Tendulkar, Gautam Gambhir, Virender Sehwag and Suresh Raina all average less than 40 in home ODIs against them. In fact, Tendulkar hasn't yet scored a century in 15 matches against them in India, though he has remained unbeaten in the 80s on a couple of occasions. Overall, only one out of his 46 ODI hundreds has been scored against them.
| Batsman | ODIs | Runs | Average | Strike rate | 100s/ 50s |
| Yuvraj Singh | 12 | 589 | 73.62 | 109.68 | 3/ 1 |
| MS Dhoni | 11 | 326 | 40.75 | 80.49 | 0/ 2 |
| Sachin Tendulkar | 15 | 511 | 39.30 | 90.62 | 0/ 4 |
| Gautam Gambhir | 6 | 229 | 38.16 | 86.41 | 0/ 2 |
| Suresh Raina | 12 | 343 | 38.11 | 76.90 | 0/ 4 |
| Virender Sehwag | 17 | 641 | 37.70 | 100.78 | 0/ 6 |
Among England's current batsmen in India, Kevin Pietersen has been the stand-out performer, with an average of more than 56 and a strike rate of almost 90. Apart from scoring lots of runs, he has also been extremely consistent in India, scoring more than 25 in 11 out of 14 innings. With Pietersen opening the batting in this tournament, his performance could be a huge factor for England on Sunday.
None of the other batsmen have exceptional records in India, though Ravi Bopara has been impressive in his limited opportunities. Andrew Strauss and Paul Collingwood have strike rates of less than 80, while Matt Prior has a highest score of 38 from ten innings in India.
| Batsman | ODIs | Runs | Average | Strike rate | 100s/ 50s |
| Kevin Pietersen | 14 | 673 | 56.08 | 88.55 | 1/ 5 |
| Ravi Bopara | 6 | 172 | 43.00 | 92.97 | 0/ 2 |
| Andrew Strauss | 10 | 378 | 42.00 | 78.26 | 0/ 5 |
| Paul Collingwood | 21 | 524 | 32.75 | 78.32 | 0/ 3 |
| Ian Bell | 10 | 292 | 29.20 | 73.92 | 0/ 1 |
| Matt Prior | 12 | 158 | 17.55 | 61.96 | 0/ 0 |
Among the Indian bowlers, Harbhajan Singh is probably the one England's batsmen will be most wary of. In 16 ODIs against England at home, he has averaged almost two wickets per game, which is much better than his career average of 1.18 per game. Sreesanth's best ODI bowling figures have come against England, but he also tends to leak plenty of runs.
| Bowler | ODIs | Wickets | Average | Econ rate | Strike rate |
| Sreesanth | 4 | 10 | 16.30 | 6.07 | 16.1 |
| Harbhajan Singh | 16 | 30 | 20.90 | 4.26 | 29.4 |
| Zaheer Khan | 5 | 8 | 23.50 | 4.70 | 30.0 |
| Munaf Patel | 7 | 8 | 26.37 | 4.52 | 35.0 |
The stats for England's bowlers in India will probably worry Strauss. His strike bowler, James Anderson, has struggled to adapt to Indian conditions, though the conditions in Bangalore may not be as inimical to his style as some other venues in the country. In 14 previous attempts in India, Anderson has taken only 12 wickets, the last of which was in October 2006. Since then he has gone six matches without a wicket, during which period he has bowled 45 overs and conceded 302 runs - an economy rate of 6.71. In fact, 302 is also the number of legitimate deliveries Anderson has bowled since picking up his last ODI wicket in India. His performance against Netherlands on Tuesday, when he returned figures of none for 72 in ten, won't help his cause either.
Graeme Swann has been more successful, but even his economy rate is relatively high.
| Bowler | ODIs | Wickets | Average | Economy rate | Strike rate |
| Graeme Swann | 4 | 6 | 26.50 | 5.48 | 29.0 |
| Stuart Broad | 6 | 9 | 37.00 | 6.20 | 35.7 |
| James Anderson | 14 | 12 | 55.16 | 5.65 | 58.5 |
| Paul Collingwod | 21 | 5 | 70.80 | 5.80 | 73.2 |
A look at the over-wise performances of the two teams in all ODIs over the last couple of years shows that the middle overs have been the biggest strong point for India, while both teams have tended to struggle a bit in the last ten overs, conceding more runs per over than they score during this period.
| Team | Overs | Bat ave | Run rate | Bowl ave | Econ rate | Ave diff | RR diff |
| India | 1-15 | 38.45 | 5.29 | 42.72 | 5.28 | -4.27 | 0.01 |
| England | 1-15 | 38.08 | 4.97 | 36.89 | 4.81 | 1.19 | 0.16 |
| India | 16-40 | 43.41 | 5.45 | 34.51 | 5.03 | 8.90 | 0.42 |
| England | 16-40 | 37.58 | 4.88 | 34.15 | 4.82 | 3.43 | 0.06 |
| India | 41-50 | 26.86 | 7.32 | 20.09 | 7.74 | 6.77 | -0.42 |
| England | 41-50 | 18.12 | 7.14 | 22.32 | 7.48 | -4.20 | -0.34 |
Most of the factors are stacked against England, but one aspect which could favour them is the venue. England have won two out of three ODIs against India in Bangalore, though India won the most recent of those games, a truncated day-night encounter in 2008. If the weather continues to stay overcast, as it has over the last few days, the seamers could get a fair amount of assistance.
Overall, though, the Chinnaswamy Stadium has been a good ODI venue for India: the home team has a 11-4 win-loss record here, with an 8-2 record in day-night matches. In the most recent ODI here, against New Zealand in December last year, India chased down a target of 316 despite being 108 for 4, thanks to a brutal unbeaten 96-ball 123 by Yusuf Pathan.
Out of the 11 completed day-night matches here, six have been won by the team batting first and five by the team chasing. However, eight have gone in favour of the team winning the toss. There's hardly anything to choose between the teams batting first and second in terms of run-rates too: 5.54 for the team batting first, and 5.37 for the one batting second.
S Rajesh is stats editor of ESPNcricinfo