How the batting orders and bowling attacks stack up
India have the most proven batting line-up, South Africa have impressive averages. Sri Lanka have plenty of quality bowling options, Australia have sheer pace
Travis Basevi and George Binoy
23-Feb-2011
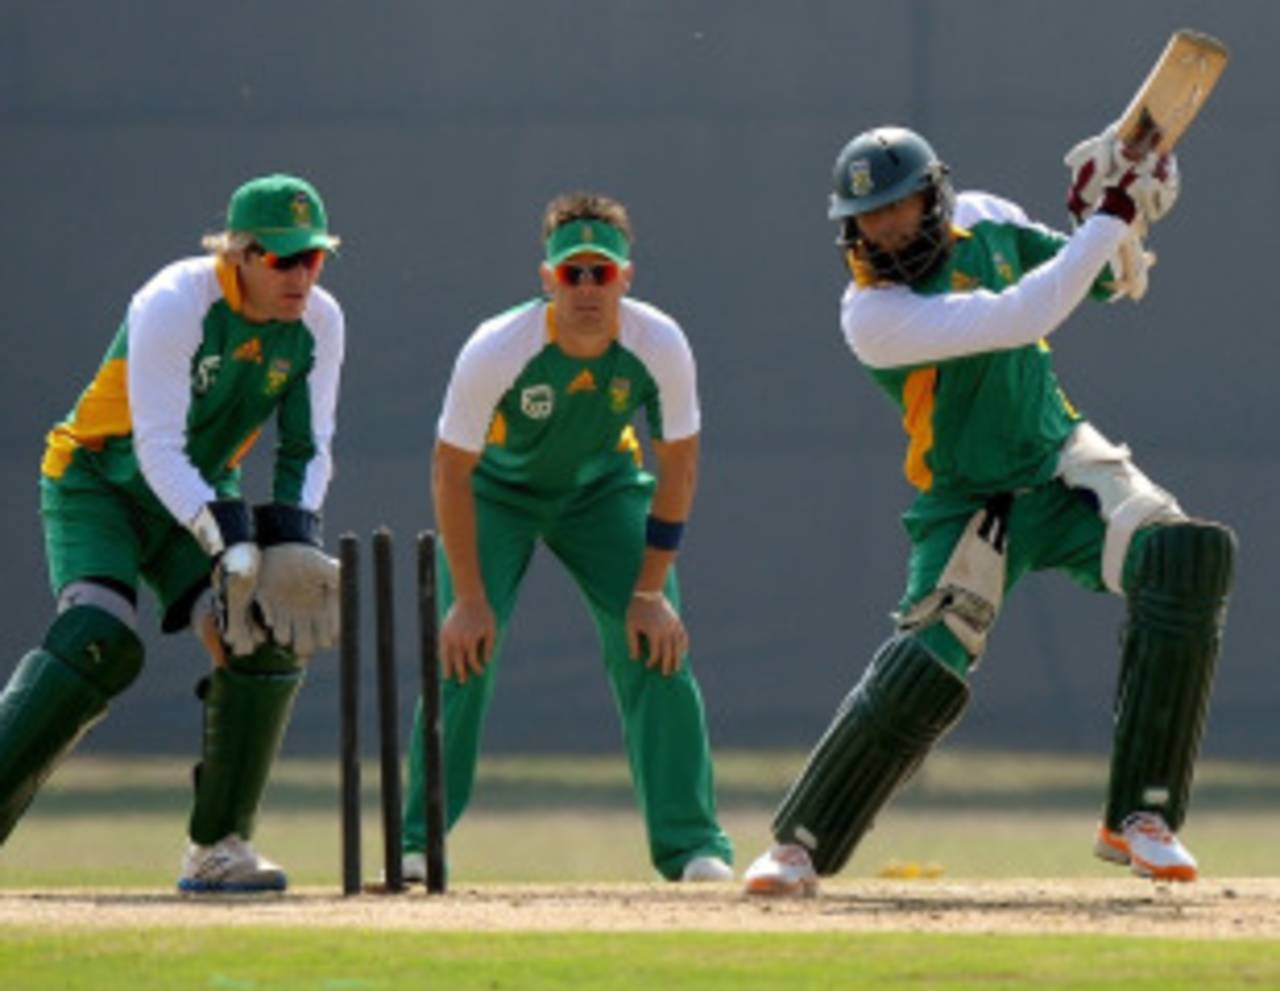
Hashim Amla has the best average in a South African top-order filled with impressive averages • AFP
The World Cup is into its fifth day, and yet it feels as though the competition has just begun. The stronger sides have wiped floors with the weaker ones - until Netherlands scared England - and the tournament is craving more closely fought contests. While we wait patiently for those nail-biters, we've taken a look at how the squads compared in terms of batting and bowling form in the lead-up to the cup that counts. The stats are as they stood on the eve of the tournament.
The players in the Indian squad have played more matches, and scored more centuries, half-centuries and runs among them than any other team in the World Cup. With Sachin Tendulkar in their ranks, of course they would. Tendulkar has more ODI runs than all of the Associate squads, Zimbabwe and nearly as much as Bangladesh. He has more than half the aggregate runs of each of the other squads. Sri Lanka's players, for instance, have 32,441 runs among them. Tendulkar has over 17,500. Similarly, he also has more one-day hundreds - 46 - than all of the other teams. Australia and South Africa, with 45 centuries each, are second to India's 96, out of which Tendulkar accounts for 46.
The best line-up, in terms of batting average, however, does not belong to India (40.01). South Africa's has a cumulative average of 45.39 and five of their batsmen average more than 40. Hashim Amla leads the way with an average of 59.88 in 42 ODIs. It is the second highest one-day average for anyone who's played at least 20 innings. The best average also belongs to someone in the World Cup - Netherlands' Ryan ten Doeschate, who averaged 68.55 in 27 matches at the start of the tournament and a bit more (71.21) after his terrific century against England on Tuesday.
Of the 15 players in their squad, New Zealand have 10 who have played at least half of their innings in the top seven since 2009. The cumulative average of those players is only 28.79, though, the second lowest among the Full Members, ahead of only Bangladesh. Among the major sides, New Zealand, along with Sri Lanka, Pakistan and Bangladesh, are the teams without a single batsman with an ODI average of more than 40.
| Team | Num | Ave Sum | Sum/Num | High | 40+ |
|---|---|---|---|---|---|
| South Africa | 6 | 272.38 | 45.39 | 59.88 | 5 |
| India | 8 | 320.15 | 40.01 | 48.80 | 4 |
| Australia | 9 | 329.11 | 36.56 | 44.00 | 4 |
| Netherlands | 8 | 267.03 | 33.37 | 68.55 | 2 |
| England | 9 | 299.76 | 33.30 | 53.62 | 2 |
| West Indies | 8 | 249.42 | 31.17 | 44.07 | 2 |
| Sri Lanka | 9 | 271.80 | 30.20 | 36.86 | 0 |
| Zimbabwe | 6 | 174.10 | 29.01 | 32.42 | 0 |
| Pakistan | 7 | 201.95 | 28.85 | 39.93 | 0 |
| Ireland | 9 | 259.20 | 28.80 | 40.86 | 1 |
| New Zealand | 10 | 287.91 | 28.79 | 35.70 | 0 |
| Bangladesh | 9 | 257.05 | 28.56 | 34.98 | 0 |
| Canada | 5 | 127.40 | 25.48 | 37.73 | 0 |
| Kenya | 10 | 241.11 | 24.11 | 34.18 | 0 |
To determine which squad has the best tail, we've looked at lower-order batsmen who have batted in at least 10 matches, with more than half their innings below No. 7 in the line-up. The two Australians that meet those conditions are Brett Lee and Mitchell Johnson, who have handy lower-order averages of 16.45 and 17.82. So Australia's depth in addition to their top-order, which is below only South Africa and India, gives them a solid batting line-up.
It's just as well for India that they have one of the best top-orders in the tournament because their tail is the worst. Their six tailenders have a cumulative average of 8.35 among them, which is lower than that of all the Associates.
The best lower-order batsman in terms of numbers could also be one of the most dangerous players in the World Cup. Abdul Razzaq, who averages 30 in 200 innings, has won several limited-over games single-handedly from impossible situations for Pakistan in 2010 - most of them from extremely low in the batting order.
| Team | Num | Ave Sum | Sum/Num | High | 20+ |
|---|---|---|---|---|---|
| Ireland | 1 | 21.23 | 21.23 | 21.23 | 1 |
| Australia | 2 | 34.07 | 17.03 | 17.61 | 0 |
| New Zealand | 3 | 48.90 | 16.30 | 23.26 | 1 |
| West Indies | 4 | 59.98 | 14.99 | 23.30 | 1 |
| Canada | 2 | 29.00 | 14.50 | 24.50 | 1 |
| England | 4 | 57.09 | 14.27 | 25.27 | 1 |
| South Africa | 4 | 50.29 | 12.57 | 18.46 | 0 |
| Netherlands | 2 | 24.75 | 12.37 | 21.25 | 1 |
| Pakistan | 6 | 70.45 | 11.74 | 30.05 | 1 |
| Bangladesh | 5 | 56.66 | 11.33 | 28.63 | 1 |
| Sri Lanka | 5 | 50.09 | 10.01 | 16.96 | 0 |
| Zimbabwe | 5 | 46.06 | 9.21 | 15.87 | 0 |
India's World Cup squad also has the highest aggregate of wickets but that is because their players played so many more matches, not because their records are especially impressive. Sri Lanka's squad has only 80 fewer wickets than India's despite playing about 200 fewer matches. Pakistan are 165 wickets behind India despite playing 681 ODIs fewer.
Australia and Sri Lanka have the best specialist bowlers in the tournament, with a cumulative average of less than 24. Australia's average, however, includes only four bowlers - Lee, Johnson, Doug Bollinger and Shaun Tait - while Sri Lanka's is comprised of six - which means they have far more quality options than most teams.
| Team | Num | Ave Sum | Sum/Num | High | 25&less |
|---|---|---|---|---|---|
| Australia | 4 | 97.06 | 24.26 | 26.39 | 3 |
| Sri Lanka | 6 | 149.36 | 24.89 | 29.78 | 3 |
| Ireland | 4 | 111.81 | 27.95 | 30.30 | 1 |
| Netherlands | 5 | 147.93 | 29.58 | 36.17 | 2 |
| Canada | 3 | 91.41 | 30.47 | 32.78 | 0 |
| Kenya | 3 | 93.43 | 31.14 | 34.29 | 0 |
| Pakistan | 6 | 188.83 | 31.47 | 46.33 | 2 |
| India | 6 | 189.80 | 31.63 | 33.67 | 0 |
| South Africa | 6 | 194.61 | 32.43 | 50.33 | 2 |
| England | 5 | 167.08 | 33.41 | 48.21 | 1 |
| Bangladesh | 6 | 204.98 | 34.16 | 47.62 | 0 |
| New Zealand | 5 | 174.57 | 34.91 | 51.00 | 0 |
| West Indies | 6 | 210.74 | 35.12 | 46.38 | 1 |
| Zimbabwe | 5 | 178.78 | 35.75 | 46.11 | 0 |
Ireland have the best part-time bowlers in the tournament but their figures are so good because they would have played most of their matches against Associates rather than the stronger teams. They have five bowlers in their squad who meet our conditions for qualifying as a part-timer and all five average below 35, with the cumulative figure being 27.28. Three Ireland bowlers in fact feature among the top four in the table of best averages for part-timers in the World Cup. Alex Cusack has 34 wickets at 20 each, Andrew White 25 at 23.60, and Andre Botha 38 at 27.52. Paul Stirling's in the top ten as well, with ten wickets at 30.60.
| Team | Num | Ave Sum | Sum/Num | High | 35&less |
|---|---|---|---|---|---|
| Ireland | 5 | 136.40 | 27.28 | 34.35 | 5 |
| Canada | 2 | 60.43 | 30.21 | 32.37 | 2 |
| Australia | 5 | 155.70 | 31.14 | 36.60 | 3 |
| Pakistan | 2 | 67.10 | 33.55 | 35.26 | 1 |
| West Indies | 4 | 145.33 | 36.33 | 45.42 | 2 |
| New Zealand | 2 | 74.87 | 37.43 | 39.44 | 0 |
| South Africa | 3 | 123.85 | 41.28 | 52.83 | 1 |
| England | 4 | 167.56 | 41.89 | 55.20 | 1 |
| Bangladesh | 3 | 127.13 | 42.37 | 51.54 | 0 |
| Kenya | 4 | 170.37 | 42.59 | 50.75 | 1 |
If there's a particular List you would like to see, email us with your comments and suggestions.
Travis Basevi is a cricket statistician and UK Senior Programmer for Cricinfo and other ESPN sports websites. George Binoy is an Assistant Editor at ESPNcricinfo