Post-captaincy performers
How players have fared in their post-captaincy careers compared to their performance when at the helm
Travis Basevi and George Binoy
20-Apr-2011
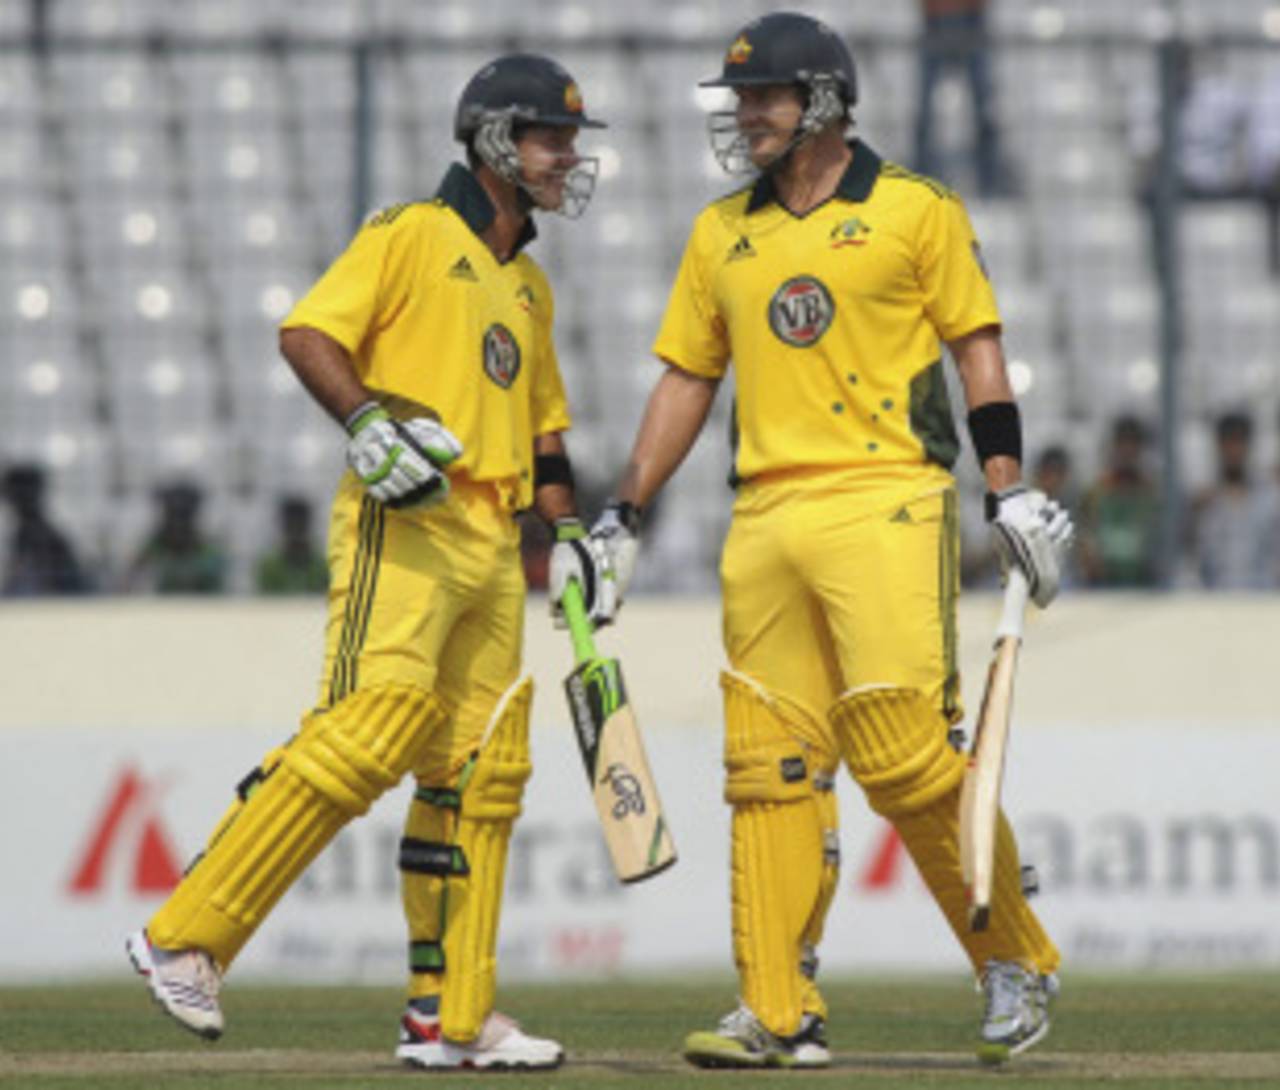
Ricky Ponting made a satisfactory start to his post-captaincy career • Associated Press
In his first series after giving up the Australian captaincy, Ricky Ponting scored 118 in three ODI innings against Bangladesh and averaged 59. His uninhibited approach was an encouraging first step in the final phase of his career, ahead of tougher opponents in Sri Lanka and South Africa. As captain, Ponting averaged 51.51 in Tests and 43.30 in ODIs so he has high standards to maintain as he returns to the ranks. This week we've looked at how players have fared in their post-captaincy careers compared to their performance when at the helm.
Gerry Alexander, the former West Indies captain who died on April 16, was captain in 18 of his 25 Tests. He led the team during a period of change - he was the Caribbean's last white captain - and had to deal with difficult situations such as the one involving Roy Gilchrist, whom Alexander sent home from the 1958-59 tour of India for bowling several beamers too many. Alexander had the reputation of an attacking batsman but during his captaincy he made only 466 runs in 24 innings at an average of 22. He played only one series after being succeeded by Frank Worrell but it was his best as a batsman. On the 1960-61 tour of Australia - the tied-Test series - Alexander made at least a half-century in each match and finished with 484 runs in 10 innings at an average of 60.50. The difference of 38 between his batting average as captain and after giving up the captaincy is the greatest for any player.
Few captaincy stints have been more disastrous in terms of results, both for team and individual, than Ian Botham's. No riposte after giving up the leadership has been more jaw dropping. Botham was captain for 12 Tests - nine against West Indies and three against Australia - in 1980-81 and England won none of them. His form with the ball in those games - an average of 33 - wasn't horrendous but his stats with the bat were - 276 runs at an average of 13. He quit two Tests into the Ashes - Australia were up 1-0 - and then scripted England cricket's finest hours. Bothan's batting averaged soared to 52 in the four remaining Tests, his bowling average plummeted to 20 and England won the Ashes.
| Player | Span | Mat | Runs | Ave | HS | 100 | Captain | Mat | Runs | Ave | Diff | ||
|---|---|---|---|---|---|---|---|---|---|---|---|---|---|
| FCM Alexander (WI) | 1960-1961 | 5 | 484 | 60.50 | 108 | 1 | 1958-1960 | 18 | 466 | 22.19 | 38.30 | ||
| IT Botham (Eng) | 1981-1992 | 65 | 3588 | 35.52 | 208 | 8 | 1980-1981 | 12 | 276 | 13.14 | 22.38 | ||
| A Flower (Zim) | 2000-2002 | 20 | 1952 | 67.31 | 232* | 5 | 1993-2000 | 20 | 1380 | 49.28 | 18.02 | ||
| PA de Silva (SL) | 1999-2002 | 17 | 1131 | 43.50 | 206 | 3 | 1991-1999 | 6 | 260 | 26.00 | 17.50 | ||
| S Chanderpaul (WI) | 2006-2010 | 35 | 2833 | 61.58 | 166 | 8 | 2005-2006 | 14 | 1038 | 47.18 | 14.40 | ||
| GN Yallop (Aus) | 1979-1984 | 24 | 1691 | 42.27 | 268 | 5 | 1978-1979 | 7 | 424 | 30.28 | 11.98 | ||
| Wasim Bari (Pak) | 1978-1984 | 39 | 618 | 16.26 | 85 | 0 | 1977-1978 | 6 | 45 | 6.42 | 9.83 | ||
| Wasim Akram (Pak) | 2000-2002 | 13 | 474 | 33.85 | 100 | 1 | 1993-1999 | 25 | 894 | 24.16 | 9.69 | ||
| DI Gower (Eng) | 1990-1992 | 11 | 848 | 53.00 | 157* | 3 | 1982-1989 | 32 | 2267 | 43.59 | 9.40 | ||
| PR Umrigar (India) | 1958-1962 | 25 | 1609 | 41.25 | 172* | 6 | 1955-1958 | 8 | 394 | 32.83 | 8.42 | ||
| AC Gilchrist (Aus) | 2004-2008 | 37 | 1898 | 41.26 | 162 | 6 | 2000-2004 | 6 | 305 | 33.88 | 7.37 | ||
| SC Ganguly (India) | 2005-2008 | 29 | 2146 | 44.70 | 239 | 4 | 2000-2005 | 49 | 2561 | 37.66 | 7.04 | ||
| SR Tendulkar (India) | 2000-2011 | 101 | 8656 | 58.09 | 248* | 29 | 1996-2000 | 25 | 2054 | 51.35 | 6.74 | ||
| SP Fleming (NZ) | 2007-2008 | 7 | 552 | 46.00 | 87 | 0 | 1997-2006 | 80 | 5156 | 40.59 | 5.40 | ||
| Saeed Anwar (Pak) | 2000-2001 | 9 | 469 | 39.08 | 123 | 2 | 1996-2000 | 7 | 414 | 34.50 | 4.58 | ||
| N Hussain (Eng) | 2003-2004 | 12 | 837 | 39.85 | 116 | 2 | 1999-2003 | 45 | 2487 | 36.04 | 3.81 | ||
| SM Gavaskar (India) | 1985-1987 | 19 | 1468 | 54.37 | 176 | 4 | 1976-1985 | 47 | 3449 | 50.72 | 3.64 | ||
| SV Carlisle (Zim) | 2003-2005 | 10 | 486 | 28.58 | 118 | 2 | 2001-2002 | 6 | 319 | 26.58 | 2.00 | ||
| A Shrewsbury (Eng) | 1888-1893 | 6 | 359 | 35.90 | 106 | 1 | 1884-1887 | 7 | 347 | 34.70 | 1.20 | ||
| ST Jayasuriya (SL) | 2003-2007 | 34 | 2184 | 37.65 | 253 | 4 | 1999-2002 | 38 | 2177 | 36.89 | 0.75 | ||
| A Ranatunga (SL) | 1999-2000 | 10 | 444 | 37.00 | 88 | 0 | 1989-1999 | 56 | 3118 | 36.25 | 0.74 | ||
| AJ Stewart (Eng) | 2001-2003 | 23 | 1277 | 39.90 | 123 | 1 | 1993-2001 | 15 | 1059 | 39.22 | 0.68 |
Marcus Trescothick captained England in only two Tests - against New Zealand at Lord's in 2004, and at Multan in 2005 - and he holds the record for the highest score in a final match as captain. Standing in for Michael Vaughan, whose knees were shot, Trescothick made 193 against Pakistan, a match the hosts won by 22 runs. Vaughan returned for the next Test, and Trescothick never led England again.
Trevor Goddard, the South Africa allrounder, played 41 Tests and led his country in 13 of them. In those Tests Goddard took only 24 wickets in 23 innings, bowling left-arm medium-pace, at an average of 36, which was far too high for a quality allrounder in the 1960s. After his term ended, Goddard played eight more Tests, under Peter van der Merwe and Ali Bacher - all against Australia - and his returns were much improved: 35 wickets in eight Tests at 18 apiece. Goddard's 8 for 92 in Johannesburg in 1966 helped South Africa beat Australia for the first time at home. The difference of 18 between Goddard's bowling average as captain and after captaincy is the highest for a bowler.
The best bowling figures in a final Test as captain belong to West Indian allrounder Denis Atkinson, who took 7 for 53 in Auckland in 1956. New Zealand won that match, though, by 190 runs and ended a 26-year wait for a maiden Test win. Atkinson played only three more Tests for West Indies and ended his career under the captaincy of Alexander.
| Player | Span | Mat | Wkts | Ave | BBI | 5 | Captain | Mat | Wkts | Ave | Diff | ||
|---|---|---|---|---|---|---|---|---|---|---|---|---|---|
| TL Goddard (SA) | 1966-1970 | 8 | 35 | 17.85 | 6/53 | 1 | 1963-1965 | 13 | 24 | 36.33 | -18.47 | ||
| Intikhab Alam (Pak) | 1976-1977 | 4 | 17 | 25.23 | 4/35 | 0 | 1969-1975 | 17 | 54 | 31.74 | -6.50 | ||
| S Venkataraghavan (India) | 1979-1983 | 10 | 17 | 58.70 | 3/77 | 0 | 1974-1979 | 5 | 7 | 64.57 | -5.86 | ||
| GS Sobers (WI) | 1973-1974 | 7 | 20 | 29.50 | 3/27 | 0 | 1965-1972 | 39 | 117 | 34.00 | -4.50 | ||
| CA Walsh (WI) | 1998-2001 | 36 | 166 | 21.59 | 6/61 | 7 | 1994-1997 | 22 | 85 | 25.71 | -4.12 | ||
| IT Botham (Eng) | 1981-1992 | 65 | 209 | 34.18 | 8/103 | 13 | 1980-1981 | 12 | 35 | 33.08 | 1.10 | ||
| A Flintoff (Eng) | 2008-2009 | 12 | 29 | 38.00 | 5/92 | 1 | 2006-2007 | 11 | 34 | 34.44 | 3.55 | ||
| N Kapil Dev (India) | 1987-1994 | 43 | 123 | 30.26 | 6/84 | 4 | 1983-1987 | 34 | 111 | 26.35 | 3.90 | ||
| SM Pollock (SA) | 2003-2008 | 40 | 143 | 27.79 | 6/39 | 2 | 2000-2003 | 26 | 103 | 21.36 | 6.42 | ||
| Wasim Akram (Pak) | 2000-2002 | 13 | 31 | 30.00 | 6/61 | 3 | 1993-1999 | 25 | 107 | 23.35 | 6.64 | ||
| ST Jayasuriya (SL) | 2003-2007 | 34 | 29 | 38.20 | 5/34 | 1 | 1999-2002 | 38 | 44 | 25.29 | 12.91 | ||
| BS Bedi (India) | 1978-1979 | 6 | 14 | 40.92 | 3/98 | 0 | 1976-1978 | 22 | 106 | 24.82 | 16.10 | ||
| BE Congdon (NZ) | 1976-1978 | 11 | 8 | 51.87 | 5/65 | 1 | 1972-1975 | 17 | 33 | 35.75 | 16.11 | ||
| SR Tendulkar (India) | 2000-2011 | 101 | 28 | 65.07 | 3/31 | 0 | 1996-2000 | 25 | 4 | 38.00 | 27.07 | ||
| R Benaud (Aus) | 1964-1964 | 3 | 7 | 53.85 | 4/118 | 0 | 1958-1963 | 28 | 138 | 25.78 | 28.06 | ||
| Fazal Mahmood (Pak) | 1962-1962 | 3 | 5 | 86.00 | 3/130 | 0 | 1959-1961 | 10 | 41 | 19.14 | 66.85 | ||
| DS Atkinson (WI) | 1957-1958 | 3 | 3 | 109.33 | 1/30 | 0 | 1955-1956 | 7 | 25 | 23.00 | 86.33 |
Shivnarine Chanderpaul led West Indies in 14 Tests and 16 ODIs in 2005-06 and didn't fare too well with the bat in either format in comparison to what came after. His Test mean was 47 and in ODIs it was 30. His performances improved considerably in the years after he was replaced as captain. Between 2006 and now, as a member of the ranks, Chanderpaul has averaged 62 in 35 Tests and 55.52 in 85 ODIs.
With his 104 in the 2011 World Cup quarter-final against India, Ricky Ponting became the sixth batsman to score a century in his final match as ODI captain, the others being Bevan Congdon, Ravi Shastri, Jacques Kallis, Tillakaratne Dilshan and Kevin Pietersen, who made 111 in Cuttack in 2008 before the fallout Peter Moores. Dilshan, however, will take himself off that list when he captains Sri Lanka in England.
| Player | Span | Mat | Runs | Ave | HS | 100 | Captain | Mat | Runs | Ave | Diff | ||
|---|---|---|---|---|---|---|---|---|---|---|---|---|---|
| S Chanderpaul (WI) | 2006-2011 | 85 | 3387 | 55.52 | 149* | 8 | 2005-2006 | 16 | 446 | 29.73 | 25.79 | ||
| PA de Silva (SL) | 1996-2003 | 136 | 4527 | 39.71 | 145 | 8 | 1992-1996 | 18 | 307 | 18.05 | 21.65 | ||
| SM Gavaskar (India) | 1985-1987 | 48 | 1776 | 44.40 | 103* | 1 | 1980-1985 | 37 | 702 | 26.00 | 18.40 | ||
| A Flower (Zim) | 2000-2003 | 68 | 2516 | 41.93 | 145 | 3 | 1993-2000 | 52 | 1207 | 25.14 | 16.78 | ||
| T Duffin (Zim) | 2006-2007 | 10 | 298 | 29.80 | 88 | 0 | 2006-2006 | 13 | 248 | 19.07 | 10.72 | ||
| SR Tendulkar (India) | 2000-2011 | 216 | 9342 | 48.40 | 200* | 24 | 1996-2000 | 73 | 2454 | 37.75 | 10.65 | ||
| SM Pollock (SA) | 2005-2008 | 61 | 857 | 29.55 | 90 | 0 | 2000-2005 | 92 | 630 | 19.09 | 10.46 | ||
| SK Warne (Aus) | 1999-2003 | 85 | 504 | 15.27 | 36 | 0 | 1998-1999 | 11 | 32 | 6.40 | 8.87 | ||
| MO Odumbe (Kenya) | 2002-2003 | 20 | 463 | 27.23 | 55 | 0 | 1996-2001 | 20 | 359 | 18.89 | 8.34 | ||
| DPMD Jayawardene (SL) | 2009-2011 | 42 | 1381 | 40.61 | 123 | 4 | 2004-2009 | 94 | 2555 | 32.75 | 7.86 | ||
| A Flintoff (Eng) | 2007-2009 | 26 | 410 | 24.11 | 78* | 0 | 2006-2007 | 14 | 247 | 17.64 | 6.47 | ||
| Moin Khan (Pak) | 2003-2004 | 29 | 413 | 22.94 | 72* | 0 | 1995-2001 | 34 | 401 | 18.22 | 4.71 | ||
| T Taibu (Zim) | 2007-2011 | 52 | 1591 | 33.85 | 107* | 2 | 2004-2005 | 29 | 760 | 29.23 | 4.62 | ||
| SC Ganguly (India) | 2007-2007 | 30 | 1120 | 43.07 | 98 | 0 | 1999-2005 | 146 | 5082 | 38.79 | 4.28 | ||
| Saeed Anwar (Pak) | 2000-2003 | 47 | 1740 | 40.46 | 105* | 3 | 1995-2000 | 11 | 363 | 36.30 | 4.16 | ||
| AC Gilchrist (Aus) | 2007-2008 | 17 | 569 | 37.93 | 118 | 1 | 2001-2007 | 17 | 554 | 34.62 | 3.30 | ||
| PD Collingwood (Eng) | 2009-2011 | 35 | 1129 | 38.93 | 105* | 1 | 2007-2009 | 25 | 718 | 35.90 | 3.03 | ||
| Younis Khan (Pak) | 2010-2011 | 24 | 515 | 24.52 | 73 | 0 | 2005-2009 | 21 | 463 | 22.04 | 2.47 | ||
| Wasim Akram (Pak) | 2000-2003 | 65 | 683 | 20.08 | 49* | 0 | 1993-2000 | 109 | 1341 | 17.64 | 2.44 | ||
| K Srikkanth (India) | 1990-1992 | 22 | 605 | 28.80 | 82 | 0 | 1989-1989 | 13 | 340 | 28.33 | 0.47 |
Travis Basevi is a cricket statistician and UK Senior Programmer for Cricinfo and other ESPN sports websites. George Binoy is an Assistant Editor at ESPNcricinfo