Amla the one-day run machine
Players with significantly better statistics in one form of the game compared to the other
Travis Basevi and George Binoy
27-Oct-2010
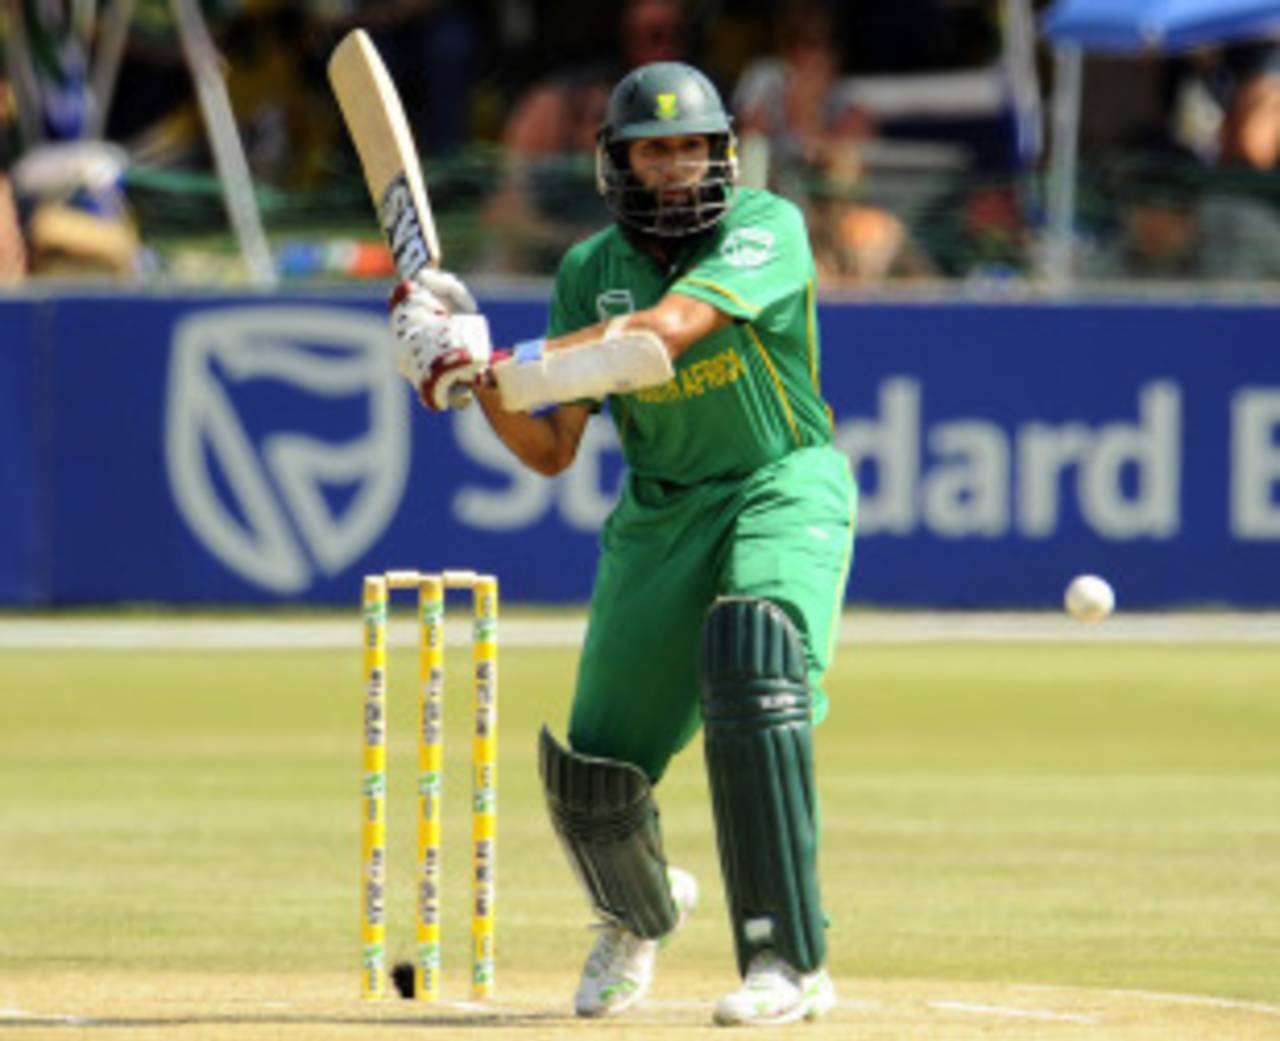
Hashim Amla is presently in rich one-day form • AFP
Scroll up the list of players with the best one-day averages and you'll see expected names with means boosted by a high number of not-out innings. MS Dhoni, check. Michael Hussey, check. Michael Bevan, check. And then, at No. 2, there's Hashim Amla. Steady, calm, former Test-specialist Amla, who wasn't in that ODI chart a few months ago. Amla averages 57.67 in one-day internationals, a figure that towers over his Test mean of 45.10, when you might have expected it to be the other way around. He is one among several players who have significantly better statistics in one format compared to the other.
Amla made his Test debut in November 2004 and played 22 Tests for South Africa before getting an ODI cap. He started steadily but not spectacularly in the limited-overs format and had only one hundred to go with five half-centuries after 24 games. He was averaging 48. The rapid upturn began in May 2010 during South Africa's tour of the West Indies. Amla scored 402 in five matches in that series and followed up with 244 in three against Zimbabwe at home. Those performances raised his average by nine runs and his century count to five. He will now face Pakistan's more testing attack in the UAE to try and widen the gap between his ODI and Test mean.
Amla's team-mate JP Duminy is another batsman whose one-day average is superior to his Test average, but it wasn't always so. At the end of his debut series in Australia, Duminy averaged 61 in Tests, but mediocre performances thereafter caused his mean to fall to 28.77 after 12 matches. In one-day internationals, Duminy averaged 5.80 after five games and 19.80 after 13. Following his second century in his 61st game - 129 against Zimbabwe in Benoni - Duminy's ODI average is 38.52, nearly ten runs more than his Test figure.
| Player | Tests | Mat | Runs | Ave | HS | 100 | ODIs | Mat | Runs | Ave | HS | 100 | Diff | ||
|---|---|---|---|---|---|---|---|---|---|---|---|---|---|---|---|
| MG Bevan (Aus) | 1994-1998 | 18 | 785 | 29.07 | 91 | 0 | 1994-2004 | 232 | 6912 | 53.58 | 108* | 6 | -24.50 | ||
| Saleem Elahi (Pak) | 1995-2003 | 13 | 436 | 18.95 | 72 | 0 | 1995-2004 | 48 | 1579 | 36.72 | 135 | 4 | -17.76 | ||
| NV Knight (Eng) | 1995-2001 | 17 | 719 | 23.96 | 113 | 1 | 1996-2003 | 100 | 3637 | 40.41 | 125* | 5 | -16.44 | ||
| 0 | 1995-2001 | 87 | 2717 | 38.81 | 103 | 1 | -13.69 | ||||||||
| Imrul Kayes (Ban) | 2008-2010 | 13 | 453 | 17.42 | 75 | 0 | 2008-2010 | 26 | 808 | 31.07 | 101 | 1 | -13.65 | ||
| HM Amla (SA) | 2004-2010 | 46 | 3383 | 45.10 | 253* | 10 | 2008-2010 | 32 | 1615 | 57.67 | 140 | 5 | -12.57 | ||
| NC Johnson (Zim) | 1998-2000 | 13 | 532 | 24.18 | 107 | 1 | 1998-2000 | 48 | 1679 | 36.50 | 132* | 4 | -12.31 | ||
| HH Dippenaar (SA) | 1999-2007 | 38 | 1718 | 30.14 | 177* | 3 | 1999-2007 | 107 | 3421 | 42.23 | 125* | 4 | -12.09 | ||
| BRM Taylor (Zim) | 2004-2005 | 10 | 422 | 21.10 | 78 | 0 | 2004-2010 | 108 | 3172 | 33.04 | 145* | 3 | -11.94 | ||
| 0 | 2005-2009 | 31 | 930 | 34.44 | 139 | 1 | -11.73 | ||||||||
| RS Morton (WI) | 2005-2008 | 15 | 573 | 22.03 | 70* | 0 | 2002-2010 | 56 | 1519 | 33.75 | 110* | 2 | -11.71 | ||
| A Jadeja (India) | 1992-2000 | 15 | 576 | 26.18 | 96 | 0 | 1992-2000 | 196 | 5359 | 37.47 | 119 | 6 | -11.29 | ||
| JP Duminy (SA) | 2008-2010 | 12 | 518 | 28.77 | 166 | 1 | 2004-2010 | 61 | 1541 | 38.52 | 129 | 2 | -9.74 | ||
| MS Dhoni (India) | 2005-2010 | 48 | 2602 | 40.65 | 148 | 4 | 2004-2010 | 172 | 5733 | 50.28 | 183* | 7 | -9.63 | ||
| CZ Harris (NZ) | 1992-2002 | 23 | 777 | 20.44 | 71 | 0 | 1990-2004 | 250 | 4379 | 29.00 | 130 | 1 | -8.55 | ||
| 0 | 1982-1993 | 44 | 425 | 23.61 | 49* | 0 | -8.50 | ||||||||
| CWJ Athey (Eng) | 1980-1988 | 23 | 919 | 22.97 | 123 | 1 | 1980-1988 | 31 | 848 | 31.40 | 142* | 2 | -8.43 | ||
| L Klusener (SA) | 1996-2004 | 49 | 1906 | 32.86 | 174 | 4 | 1996-2004 | 171 | 3576 | 41.10 | 103* | 2 | -8.24 | ||
| SC Williams (WI) | 1994-2002 | 31 | 1183 | 24.14 | 128 | 1 | 1994-1999 | 57 | 1586 | 32.36 | 105* | 1 | -8.22 |
Pakistan's Younis Khan, who is making a comeback in the ODI series against South Africa after all sorts of problems with the PCB, has had a one-day career that hasn't matched his Test career. Younis' Test average leapt from 39 to 44 in his 35th game - a match in which he scored 267 and 84 in Bangalore - and has stayed above 40 ever since. He's steadily improved since then and now averages a shade over 50 after 63 Tests. In one-dayers, however, Younis presently averages only 32.57 after 202 games and has never passed 35 after his second limited-overs appearance for Pakistan.
Is VVS Laxman the best batsman to have never been selected for a World Cup? He never quite managed to cement a long-term spot in India's ODI team, a format in which he averaged 30.76 compared to 47.40 in Tests. Not featuring in a World Cup campaign was tough luck, though, considering India have taken less capable batsmen such as Dinesh Mongia, S Ramesh and Mohammad Kaif on previous campaigns.
| Player | Tests | Mat | Runs | Ave | HS | 100 | ODIs | Mat | Runs | Ave | HS | 100 | Diff | ||
|---|---|---|---|---|---|---|---|---|---|---|---|---|---|---|---|
| 12 | 1998-2010 | 41 | 748 | 27.70 | 105* | 2 | 26.01 | ||||||||
| GRJ Matthews (Aus) | 1983-1993 | 33 | 1849 | 41.08 | 130 | 4 | 1984-1993 | 59 | 619 | 16.72 | 54 | 0 | 24.35 | ||
| GR Viswanath (India) | 1969-1983 | 91 | 6080 | 41.93 | 222 | 14 | 1974-1982 | 25 | 439 | 19.95 | 75 | 0 | 21.97 | ||
| VG Kambli (India) | 1993-1995 | 17 | 1084 | 54.20 | 227 | 4 | 1991-2000 | 104 | 2477 | 32.59 | 106 | 2 | 21.60 | ||
| DPMD Jayawardene (SL) | 1997-2010 | 113 | 9408 | 54.06 | 374 | 28 | 1998-2010 | 326 | 9003 | 32.73 | 128 | 12 | 21.33 | ||
| KC Sangakkara (SL) | 2000-2010 | 91 | 8016 | 56.85 | 287 | 23 | 2000-2010 | 276 | 8510 | 36.83 | 138* | 10 | 20.01 | ||
| 7 | 1984-1993 | 63 | 1269 | 24.40 | 126* | 1 | 19.94 | ||||||||
| AR Border (Aus) | 1978-1994 | 156 | 11174 | 50.56 | 205 | 27 | 1979-1994 | 273 | 6524 | 30.62 | 127* | 3 | 19.93 | ||
| KD Walters (Aus) | 1965-1981 | 74 | 5357 | 48.26 | 250 | 15 | 1971-1981 | 28 | 513 | 28.50 | 59 | 0 | 19.76 | ||
| MJ Slater (Aus) | 1993-2001 | 74 | 5312 | 42.83 | 219 | 14 | 1993-1997 | 42 | 987 | 24.07 | 73 | 0 | 18.76 | ||
| JF Reid (NZ) | 1979-1986 | 19 | 1296 | 46.28 | 180 | 6 | 1980-1986 | 25 | 633 | 27.52 | 88 | 0 | 18.76 | ||
| V Sehwag (ICC/India) | 2001-2010 | 81 | 7152 | 53.37 | 319 | 21 | 1999-2010 | 228 | 7380 | 34.64 | 146 | 13 | 18.72 | ||
| 32 | 1986-2002 | 325 | 7569 | 32.90 | 120* | 3 | 18.15 | ||||||||
| Younis Khan (Pak) | 2000-2009 | 63 | 5260 | 50.09 | 313 | 16 | 2000-2010 | 202 | 5765 | 32.57 | 144 | 6 | 17.52 | ||
| JD Ryder (NZ) | 2008-2009 | 11 | 898 | 49.88 | 201 | 2 | 2008-2010 | 24 | 695 | 33.09 | 105 | 1 | 16.79 | ||
| MJ Prior (Eng) | 2007-2010 | 35 | 1896 | 42.13 | 131* | 3 | 2004-2010 | 55 | 1066 | 25.38 | 87 | 0 | 16.75 | ||
| DL Houghton (Zim) | 1992-1997 | 22 | 1464 | 43.05 | 266 | 4 | 1983-1997 | 63 | 1530 | 26.37 | 142 | 1 | 16.67 | ||
| VVS Laxman (India) | 1996-2010 | 114 | 7490 | 47.40 | 281 | 16 | 1998-2006 | 86 | 2338 | 30.76 | 131 | 6 | 16.64 | ||
| 12 | 1992-2003 | 213 | 6786 | 35.34 | 145 | 4 | 16.20 | ||||||||
| BM McMillan (SA) | 1992-1998 | 38 | 1968 | 39.36 | 113 | 3 | 1991-1998 | 78 | 841 | 23.36 | 127 | 1 | 15.99 |
The largest difference between the Test and ODI batting average, however, belongs to Sri Lanka's Thilan Samaraweera, whose stats in the respective formats are 53.72 and 27.70. Before Samaraweera made a comeback to the ODI side in July 2009, the difference between his Test and ODI average was 34 runs. Since then, he's improved his ODI mean to 27.70, reducing the gap between his Test figure to 26.
You'd expect a player who has a ODI bowling average of 103.63 compared to a Test mean of 31.43 to be a part-timer who had a few good spells in one format and little success in the other. That difference of 72, however, belongs to Pommie Mbangwa, who was a specialist fast bowler for Zimbabwe between 1996 and 2002. He had a average Test record but his ODI career was poor - Mbangwa was wicketless in 21 out of 29 innings and took only 11 wickets in the other eight.
| Player | Tests | Mat | Wkts | Ave | BBI | 5 | ODIs | Mat | Wkts | Ave | BBI | 5 | Diff | ||
|---|---|---|---|---|---|---|---|---|---|---|---|---|---|---|---|
| 0 | 1996-2002 | 29 | 11 | 103.63 | 2/24 | 0 | -72.19 | ||||||||
| JG Bracewell (NZ) | 1980-1990 | 41 | 102 | 35.81 | 6/32 | 4 | 1983-1990 | 53 | 33 | 57.09 | 2/3 | 0 | -21.27 | ||
| KD Ghavri (India) | 1974-1981 | 39 | 109 | 33.54 | 5/33 | 4 | 1975-1981 | 19 | 15 | 47.20 | 3/40 | 0 | -13.65 | ||
| Shabbir Ahmed (Pak) | 2003-2005 | 10 | 51 | 23.03 | 5/48 | 2 | 1999-2005 | 32 | 33 | 36.12 | 3/32 | 0 | -13.08 | ||
| DJ Nash (NZ) | 1992-2001 | 32 | 93 | 28.48 | 6/27 | 3 | 1992-2002 | 81 | 64 | 40.96 | 4/38 | 0 | -12.48 | ||
| DS de Silva (SL) | 1982-1984 | 12 | 37 | 36.40 | 5/59 | 1 | 1975-1985 | 41 | 32 | 48.65 | 3/29 | 0 | -12.25 | ||
| 6 | 1992-2000 | 42 | 36 | 40.52 | 4/25 | 0 | -11.22 | ||||||||
| TBA May (Aus) | 1987-1995 | 24 | 75 | 34.74 | 5/9 | 3 | 1987-1995 | 47 | 39 | 45.43 | 3/19 | 0 | -10.68 | ||
| KR Pushpakumara (SL) | 1994-2001 | 23 | 58 | 38.65 | 7/116 | 4 | 1994-1999 | 31 | 24 | 49.20 | 3/25 | 0 | -10.55 | ||
| BA Reid (Aus) | 1985-1992 | 27 | 113 | 24.63 | 7/51 | 5 | 1986-1992 | 61 | 63 | 34.96 | 5/53 | 1 | -10.33 | ||
| Tauseef Ahmed (Pak) | 1980-1993 | 34 | 93 | 31.72 | 6/45 | 3 | 1982-1990 | 70 | 55 | 40.85 | 4/38 | 0 | -9.13 | ||
| Mohammad Asif (Pak) | 2005-2010 | 23 | 106 | 24.36 | 6/41 | 7 | 2005-2010 | 38 | 46 | 33.13 | 3/28 | 0 | -8.76 | ||
| 3 | 1987-1997 | 75 | 45 | 50.24 | 3/22 | 0 | -8.19 | ||||||||
| SD Anurasiri (SL) | 1986-1998 | 18 | 41 | 37.75 | 4/71 | 0 | 1986-1994 | 45 | 32 | 45.75 | 3/40 | 0 | -7.99 | ||
| RJ Sidebottom (Eng) | 2001-2010 | 22 | 79 | 28.24 | 7/47 | 5 | 2001-2010 | 25 | 29 | 35.82 | 3/19 | 0 | -7.58 | ||
| DW Steyn (SA) | 2004-2010 | 41 | 211 | 23.13 | 7/51 | 14 | 2005-2010 | 41 | 58 | 30.65 | 4/16 | 0 | -7.52 | ||
| JR Thomson (Aus) | 1972-1985 | 51 | 200 | 28.00 | 6/46 | 8 | 1975-1985 | 50 | 55 | 35.30 | 4/67 | 0 | -7.30 | ||
| MS Panesar (Eng) | 2006-2009 | 39 | 126 | 34.37 | 6/37 | 8 | 2007-2007 | 26 | 24 | 40.83 | 3/25 | 0 | -6.46 | ||
| 1 | 1983-1996 | 105 | 100 | 34.31 | 4/40 | 0 | -6.24 | ||||||||
| JEC Franklin (NZ) | 2001-2009 | 26 | 80 | 32.65 | 6/119 | 3 | 2001-2010 | 75 | 69 | 38.79 | 5/42 | 1 | -6.14 | ||
| CA Walsh (WI) | 1984-2001 | 132 | 519 | 24.44 | 7/37 | 22 | 1985-2000 | 205 | 227 | 30.47 | 5/1 | 1 | -6.02 | ||
| MD Marshall (WI) | 1978-1991 | 81 | 376 | 20.94 | 7/22 | 22 | 1980-1992 | 136 | 157 | 26.96 | 4/18 | 0 | -6.01 |
Former New Zealand allrounder Chris Harris is the only player to appear in both the batting and bowling tables for ODI specialists. Harris averages 29 with the bat in 250 ODIs compared to 20.44 in 23 Tests. With the ball, Harris took only 16 wickets at 73 apiece in Tests, whereas his figures in ODIs were 203 at 37.50.
Australia's Greg Matthews, another spinner, was an unsuccessful Test bowler but a successful Test batsman and an unsuccessful one-day batsman but a satisfactory one-day bowler. Matthews didn't have enough guile to take more than 61 Test wickets at 48 apiece but was determined enough to score four Test centuries and average 41 as a batsman. In ODIs, he managed 57 wickets in 54 innings at 35.15 but score only 619 runs in 50 innings at an average of 16.72.
| Player | Tests | Mat | Wkts | Ave | BBI | 5 | ODIs | Mat | Wkts | Ave | BBI | 5 | Diff | ||
|---|---|---|---|---|---|---|---|---|---|---|---|---|---|---|---|
| EAR de Silva (SL) | 1985-1991 | 10 | 8 | 129.00 | 2/67 | 0 | 1986-1992 | 28 | 17 | 56.88 | 3/38 | 0 | 72.11 | ||
| HA Gomes (WI) | 1976-1987 | 60 | 15 | 62.00 | 2/20 | 0 | 1978-1987 | 83 | 41 | 25.48 | 4/31 | 0 | 36.51 | ||
| CZ Harris (NZ) | 1992-2002 | 23 | 16 | 73.12 | 2/16 | 0 | 1990-2004 | 250 | 203 | 37.50 | 5/42 | 1 | 35.62 | ||
| 0 | 1997-2000 | 31 | 52 | 23.21 | 4/35 | 0 | 35.26 | ||||||||
| MF Maharoof (SL) | 2004-2007 | 20 | 24 | 60.75 | 4/52 | 0 | 2004-2010 | 94 | 121 | 25.89 | 6/14 | 2 | 34.85 | ||
| IVA Richards (WI) | 1974-1991 | 121 | 32 | 61.37 | 2/17 | 0 | 1975-1991 | 187 | 118 | 35.83 | 6/41 | 2 | 25.54 | ||
| Shoaib Malik (Pak) | 2001-2010 | 32 | 21 | 61.47 | 4/42 | 0 | 1999-2010 | 192 | 134 | 36.29 | 4/19 | 0 | 25.17 | ||
| BA Murphy (Zim) | 2000-2001 | 11 | 18 | 61.83 | 3/32 | 0 | 2000-2003 | 31 | 29 | 38.96 | 3/43 | 0 | 22.86 | ||
| GA Hick (Eng) | 1991-2001 | 65 | 23 | 56.78 | 4/126 | 0 | 1991-2001 | 120 | 30 | 34.20 | 5/33 | 1 | 22.58 | ||
| 1 | 1990-1995 | 64 | 103 | 23.87 | 5/45 | 1 | 22.42 | ||||||||
| Mohammad Sami (Pak) | 2001-2010 | 34 | 84 | 50.73 | 5/36 | 2 | 2001-2007 | 83 | 118 | 28.44 | 5/10 | 1 | 22.28 | ||
| GW Flower (Zim) | 1992-2004 | 67 | 25 | 61.48 | 4/41 | 0 | 1992-2010 | 221 | 104 | 40.62 | 4/32 | 0 | 20.85 | ||
| AB Agarkar (India) | 1998-2006 | 26 | 58 | 47.32 | 6/41 | 1 | 1998-2007 | 191 | 288 | 27.85 | 6/42 | 2 | 19.47 | ||
| Tapash Baisya (Ban) | 2002-2005 | 21 | 36 | 59.36 | 4/72 | 0 | 2002-2007 | 56 | 59 | 41.55 | 4/16 | 0 | 17.80 | ||
| A Ranatunga (SL) | 1982-2000 | 93 | 16 | 65.00 | 2/17 | 0 | 1982-1999 | 269 | 79 | 47.55 | 4/14 | 0 | 17.44 | ||
| 1 | 2002-2009 | 55 | 71 | 31.53 | 4/27 | 0 | 16.32 | ||||||||
| VC Drakes (WI) | 2002-2004 | 12 | 33 | 41.27 | 5/93 | 1 | 1995-2004 | 34 | 51 | 25.35 | 5/33 | 2 | 15.91 | ||
| JC Adams (WI) | 1992-2001 | 54 | 27 | 49.48 | 5/17 | 1 | 1992-2001 | 127 | 43 | 34.86 | 5/37 | 1 | 14.62 | ||
| SC Ganguly (India) | 1996-2008 | 113 | 32 | 52.53 | 3/28 | 0 | 1992-2007 | 311 | 100 | 38.49 | 5/16 | 2 | 14.04 | ||
| BAW Mendis (SL) | 2008-2010 | 12 | 50 | 32.88 | 6/117 | 2 | 2008-2010 | 44 | 78 | 19.37 | 6/13 | 3 | 13.50 | ||
| CL Hooper (WI) | 1987-2002 | 102 | 114 | 49.42 | 5/26 | 4 | 1987-2003 | 227 | 193 | 36.05 | 4/34 | 0 | 13.37 | ||
| 2 | 1984-1993 | 59 | 57 | 35.15 | 3/27 | 0 | 13.07 |
If there's a particular List you would like to see, email us with your comments and suggestions.
Travis Basevi is a cricket statistician and UK Senior Programmer for Cricinfo and other ESPN sports websites. George Binoy is an Assistant Editor at ESPNcricinfo